
How I Learned to Stop Worrying and Accept Income Inequality: Part 5
How I Learned to Stop Worrying and Accept Income Inequality Part 5: Conclusion and a Rage Against Fatalism

This blog post is the 5th and final post in a 5-part series on income inequality. Click below to navigate between the parts of the series:
Part 5: Conclusion, and a Rage Against Fatalism
If you’re still here, thanks for sticking with me for such a long series. For those that are just joining for the TLDR wrap-up, in Part 1, I explained my personal reasons for being so interested in income and wealth inequality. In a nutshell, I grew up in a place that’s pretty poor, I now live in a place that’s pretty rich and I worry about that growing inequality will needlessly destabilize our world.
In Part 2, I provided a short history of income and wealth inequality and introduced a summarized version of Picketty’s relationship between the rate of return on capital and national growth rate to explain why income and wealth tend towards greater inequality in stable systems.
In Part 3, I introduced the 4 horsemen: mass mobilization war, revolution, state collapse, and plague. I provided examples of the effects of these afflictions and made the case that for all of recorded history, they have been the primary mechanism for redistributing income and wealth.
In Part 4, I took a tour through the alternatives including land reform, economic crises, and policy changes and made the point that while there are some technically non-violent alternatives to the 4 horsemen, their record of real change is pretty dismal.
Now it’s time to tie everything back together. At the beginning of this series, I made the bold statement that global income inequality is a malady whose most likely cure is worse than the disease. What I hope to have shown through this series is that the “most likely cures” I referred to necessitate human suffering on such a scale that it is hard to imagine. As an example, a recurrence of the Black Death with similar mortality figures today would result in billions of deaths globally. The populations of entire nations would be wiped from the planet. That’s approximately the order of magnitude of shock that history suggests would be required to materially reverse the current trend of income and wealth inequality. I think that makes the cure far worse than the disease.
But in true pessimist fashion, I think all this gloom has a bit of a silver lining. My research has reassured me that current levels of inequality are not necessarily going to destabilize the planet’s economic order. It’s tempting to look at graphs like those in part 2 and conclude that rising inequality leads to violence, but that would be a spurious conclusion to draw from the data. Extreme violence levels income and wealth inequality, but there is no clearly defined causation between inequality levels and violence. The actual sparks that ignite violence appear to be too varied and complex for modern economists and historians to accurately analyze. Something certainly causes humans to instigate violence, and that something might be correlated with higher income and wealth inequality, but we do not have concrete proof of the linkage.
To the contrary, there is an enormous body of historical evidence to suggest that societies can peacefully persist at high levels of inequality for centuries at a time before devolving into violence. Given the nastiness of those violent transitions, this should come as good news for those that believe our current trajectory leads inevitably to a great unravelling. That outcome is possible, but if we look to historical empires from Rome to Egypt and more recently France and the UK, nations can exist without mass mobilization warfare or other horsemen visitations for a very long time.
This obviously doesn’t mean we’re out of the woods. By virtue of the Great Compression in the 20th century, people living today have firsthand memories of what it was like to live in a more equal society and a transition back to the historical norm may very well cause wars, revolutions, state collapse and plague. There are already dark clouds on the horizon as populist movements gain momentum throughout the world, but there is nothing predetermined about this movement. It is very hard to predict the future and it seems plausible that the current resurgence of populism is merely a hiccup in a transition to a more stable, historically normal income and wealth distribution.
And if that were to happen, the present is not a bad world to live in. Even if current inequality trends continue, the poor today are vastly better off in a material sense than they have ever been throughout human history. Although there are tremendous, incredible injustices in the world and it is in vogue to focus on those things, the 20th century witnessed staggering improvements in human quality of life. To take just one example, infant mortality fell 90% between 1915 and 1997. If I had to choose a moment in history to live in for a while, even with increasing inequality, this would be it.
One Last Note: A Rage Against Fatalism
Having spent the time to read these books, analyze them and write what must seem to be an overwhelmingly fatalist blog series, I want to end on a high note. I believe that history is the largest available data set from which we can draw conclusions and attempt to predict future events. But history is by its very definition just one observed path through an infinite set of possibilities. Just because policy changes and peaceful interventions have virtually no historical precedent for reversing growing income and wealth inequality, that doesn’t mean they aren’t worth trying. I will be doing that most idealistic thing in the coming elections: voting for elected politicians that have at least a glimmer of a chance at peacefully redistributing wealth through incentives that don’t inevitably lead to the deaths of millions of people. For all its flaws and abuses, representative democracies sometimes get it right and there’s nothing to be lost by trying.

How I Learned to Stop Worrying and Accept Income Inequality: Part 4
How I Learned to Stop Worrying and Accept Income Inequality Part 4: Peaceful Alternatives to Violent Leveling

This blog post is the 4th in a 5-part series on income inequality. Click below to navigate between the parts of the series:
Part 4: Peaceful Alternatives to Violent Leveling
Up to this point, I’ve been making the point that leveling is directly correlated with violence: the more leveling, the more violence is required. But is there really no evidence that we can achieve the same results without lots of people dying? In this part of the series, I will be examining this question in more detail to illustrate that humans have tried a lot of different non-violent methods of redistributing income and wealth, and none have been very effective.
Land Reform
For most of human history, wealth was land and vice versa. As a result, land reform efforts are the most promising place to look for peaceful redistribution.
As discussed in the section above on revolutions, Mao in China and Stalin in the Soviet Union achieved unprecedented land reform, but at the cost of millions of lives. There are examples of land redistribution which involve far less human misery, but in most of these, the threat of violence was always present, if not exercised.
In the 1980s, Zimbabwe embarked on a policy of land redistribution from wealthy white landowners to nearly 70,000 mostly poor black families. This process was radicalized in 1997 when veterans of the liberation war staged “land invasions” which coerced another eighth of farmland to be acquired and redistributed. By 2014, 90% of the land controlled by 6,000 white farmers in the 1980s had been given to approximately a quarter million families. White land ownership collapsed from 39% to .4%. But to call this process entirely peaceful would be a lie: Mugabe was forced into the latter stages of redistribution by threats of violence from veterans, which eventually caused him to join the movement in 2000 and lead to protections for those recipients of redistributed land, keeping the changes from being unraveled.
Many land reforms throughout history were carried out as part of armistice agreements ending formal wars. Examples include Japanese land reform after World War II, Czarist Russian after the Crimean War, and reform in a number of European countries after the Napoleonic wars. In the latter two cases, the results ended up worsening inequality due to poor administration, loopholes, and graft. Violence is still common among these transitions too: in the 1920s, the shock of defeat in World War I brought the Bulgarian Agrarian National Union to power in that country. Their ambitious land reform policy triggered violence from the establishment which led to the overthrow of the government. Similarly, in Guatemala after World War II, the loss of German-owned coffee plantations combined with pressure to nationalize remaining plantations led to agrarian reform by a democratically elected government in 1952. By 1954, in a peaceful process, 40% of the rural population had received land grants. Unfortunately, a coup later that year brought a military regime to power that immediately annulled the results of the redistribution, and 150,000 people died in the civil war that followed. By the 1990s, 3% of landowners held 67% of all land, and 90% of the rural population was almost entirely landless.
There are some examples of peaceful redistribution that were carried out in the shadow of potential revolution or war, especially during the Cold War. A key example is South Korea. Americans in the 1940s feared that North Korean communists might enlist South Koreans to their cause. The resulting American support of land redistribution was both peaceful and impactful. By the mid-1950s, landlords in South Korea had lost 80% of their income and the bottom 80% of rural households had gained 20-30%. The Gini coefficient of land ownership prior to the reforms was .72 and fell to ~.3 by the 1960s. This was further amplified by the Korean war, which destroyed large amounts of infrastructure and introduced hyperinflation which almost completely eliminated the South Korean landed elite. But again, the reason this created so much equalization was that the US feared a war and used its military to influence the process.
These examples further support the claim that while peaceful redistribution is possible, it is often carried out to avoid violence. Furthermore, land reform has historically been a poor leveler. A survey of 27 reforms during the second half of the twentieth century found that in 21, or 78%, land inequality either remained unchanged or became worse.
One potential recipe for peaceful land reform is to conduct the reform under the protection of a foreign power, like the South Korean and Japanese examples above. The World War II Japanese land reform proceeded using this formula. It worked in Puerto Rico in the 1940s and in Ireland in the 1870s. So there is some hope here, but it relies upon the direct appeal to force provided by a far superior occupying enemy military which is almost certainly present as the result of recent violence.
Debt Relief
Another peaceful leveling mechanism with some promise would appear to be debt relief. The idea here is that the poorest members of society very often get caught in debt traps. Although ancient Sumerians didn’t have payday loan companies and high interest credit cards, indentured servitude and sharecropping have been features of agrarian societies for thousands of years. What if the wealthy elite simply cancelled all loans in an effort to make society more economically equal? Surprisingly, we have evidence that this occurred at least a dozen times between 2400 and 1600 BCE in Mesopotamia. Sumerians, Babylonians, and Assyrian rules have all cancelled debts or freed debt-bondsmen via royal decree. Unfortunately, we know little about the effects of these efforts and since extraordinary claims require similarly extraordinary evidence, we have to conclude that these efforts were either ineffective or highly temporary levelers.
The abolition of slavery can be viewed as a form of debt relief, and is a promising candidate for successful leveling. In many historical societies, slaves represented a very large portion of owned wealth and so it would follow that any policy the emancipated slaves would reduce the wealth of slave owners and increase the incomes of former slaves.
There are a number of prominent, recent, and well-documented emancipations. France began the process in 1794, Britain emancipated slaves across its empire in 1833, and America followed suite at the end of the Civil War in 1865. Unfortunately, all of these events were directly related to violence. The British emancipation started in 1806 but was initially targeted at only non-British colonies. Then widespread slave uprisings started in Demerara in 1823 followed by uprisings in Jamaica in 1831 and 1832 which forced the issue and brought about the 1833 Emancipation Act.
The French example is equally checkered. Although France started to emancipate slaves as part of the 1794 revolution, that was subsequently reversed by Napoleon. In 1804, French-controlled Haiti declared independence and white slave owners were massacred. But even this didn’t bring about emancipation, which had to wait until the revolution of 1848 which was part of a larger wave of European violence.
In America, the Civil War, though ostensibly fought to preserve and redefine state rights, was inextricably intertwined with the issue of slavery. It was also the single bloodiest conflict that has been fought in the history of the nation. Approximately 50% of all battle-related deaths in US history are attributable to the conflict.
So violence was integral to emancipation, which rules it out as a purely peaceful leveling mechanism, but was it effective? In short, yes, but again the greater the violence, the greater the leveling. In both Britain and France, initial attempts to emancipate slaves were comparatively less violent and slave owners were compensated for the loss of their slaves by the government. This process had little effect on income or wealth inequality. In France’s later emancipation efforts and the revolution in Haiti, along with the American Civil war, violence was extreme and leveling was substantial.
Historically speaking, then, debt relief, whether through explicit cancellation of monetary debts or emancipating slaves appears to follow the same pattern as the four horsemen outlined above and isn’t a viable force for peaceful leveling. As an additional point, there just aren’t many outright slaves left in the world today, so any opportunities here probably lie in releasing bonded labor and other forms of psuedoslavery that look more like debt relief which I showed above to be ineffective at equalizing income and wealth inequality.
Economic Crises
What about peaceful crises that occur without violence? Things like banking failures, trade wars, and natural disasters have the capacity to act like mini-system collapses and reshape the order of society without going so far as to induce violence.
Unfortunately, we don’t have much data about the distant past and have to turn to more recent examples. The most comprehensive survey looks at 72 systemic banking crises from 1911 to 2010, 100 consumption declines of >10%, and 101 GDP declines of >10% between 1911 and 2006.
Among the banking crises data, 37 out of 72 yield useful information. Outcomes tended to increase rather than decrease inequality. Inequality fell in only 3, rose in 7, and remained unchanged in the remaining 27.
Among the 100 documented declines in consumption of >10%, 36 present us with usable data. Of those, inequality fell in 7 and rose in only 2, remaining unchanged in the remainder. So there is some leveling potential in nation-wide declines in consumption for equalizing outcomes. As with other violent methods, however, there is scant evidence that the poor were any better off during these declines in consumption, merely that the rich were made much worse off.
Among declines in GDP, there is no summary trend.
For those American readers, you might be wondering about the Great Depression, which surely had some sort of leveling effect, right? The answer is actually yes. During the Great Depression, top income shares fell even as real wages for those at the bottom of the distribution rose. The wealth share of the top 1% of Americans declined from 51.4% to 47% between 1928 and 1932 at the same time that the top 1% income share dropped from 23.9% to 15.5% (including capital gains income). The number of wealthy individuals shrank quickly during this time. Membership in the National Association of Manufacturers, which was mostly populated by wealthy industrialists, fell by more than 67% between the early 1920s and 1933. In just 4 years from 1929 to 1933, the number of American banks fell from 25,000 to 14,000.
Elsewhere in the world, however, the effects of the Great Depression were dramatically less pronounced. Australia, France, and the Netherlands were only moderately affected, and the effects were weaker and briefer still in Japan and New Zealand. Top income shares remained stable in Germany and Finland and actually rose in South Africa, Canada, and Denmark.
The summary here suggests that short of the Great Depression in America, relatively peaceful banking crises and declines in GDP do not appear to be capable of reducing inequality. Declines in consumption appear to be weak levelers, but are definitionally bad for individuals within a society because they lower everyone’s standard of living.
Policy Change
Policy changes are by far the most popular suggested fix for income and wealth inequality. And most of the policy changes involve taxation that redistribute wealth from the rich to the poor. Among the books I’ve read, there are countless suggestions about how best to implement such taxes, but Picketty’s suggestion of a global 2% tax on wealth is emblematic of these ideas.
First, as I’ve covered above, there is no historical precedent for peaceful redistribution like this to have any major impact on income or wealth inequality. The fact that the historical record has no examples of this approach being successful is, in my opinion, the strongest evidence that policy won’t solve the problem peacefully. Either humans are incapable of this sort of cooperation or the conditions have never been right to support these changes at any other time in recorded human history. Either way, they seem good on paper, but impossible to implement. That said, economists and writers stubbornly stick to this topic because it is the most politically correct and palatable way to address income and wealth inequality.
All of the authors I read followed a similar pattern: they suggested and reviewed policy change ideas and then conclude with a phrase like “at present, it seems unlikely that there is enough political will to make any of these changes.” That seems like a bit of a cop out. In my opinion, the primary reason why taxation can’t fix income and wealth inequality peacefully has to do with the fact that it is too easy to move wealth around in the world.
Let’s unpack my claim with an example: Picketty’s controversial, but seemingly plausible suggestion of a global tax on wealth. The idea here is that very wealthy people would be heavily taxed on their net worth, regardless of how it’s held. Poor people would pay almost nothing and people like Jeff Bezos would see their billions dwindle in just a few short years due to very high taxation.
Today, if the US were to institute a very high tax on the wealthiest people, say 70% per year, those people would simply restructure their wealth into corporate shell companies based in tax havens like the Netherlands, Singapore, or Ireland and take distributions to continue living where they pleased. If the Netherlands could be compelled to apply the same high tax law, wealth would simply move to Singapore and Ireland, and so on. Literally one country failing to pass the law would cause wealth to flow to that country, negating the redistributive effect of the tax. Rather than income and wealth being redistributed in the country where the tax was implemented, a safe haven country would get wealthier and the original country would become poorer.
But let’s wave a magic wand and assume humans could figure out a way to coordinate and get such a tax bill considered in every nation in the world. The next most-rational response from the hyper-wealthy would be to spend some large portion of their wealth to influence legislators not to pass the laws. Is it realistic to assume that a Congressman or EU parliamentary member would pass up vast personal wealth to pass such a law? What if they were offered $50 million or $100 million? Under current systems, such bribes are illegal and the bribes that do occur are relatively constrained, but if hundreds of billions in personal wealth were threatened, it would make sense to use a large portion to try to bend and break the political system to prevent such a change. At which point, wealth has simply shuffled hands between the multi-billionaires of the world to current sitting legislators, which wouldn’t improve income or wealth inequality.
But let’s go further and magically assume that all the nations of the earth do pass this wealth tax. What would physically compel billionaires to actually write the tax checks? Surely some would voluntarily do it: Warren Buffet and Bill Gates spring immediately to mind. But others may resort to force to preserve their interests. Remember from part 1 in this series that the top 1% in America currently own ~35% of all the things that can be owned in the entire country. In short, they are well funded enough to put up a fight if they were so inclined, and only the countervailing threat of government-funded military action might be a sufficient deterrent.
In this last phase, we have violated the stipulation that the tax law be peacefully implemented and every step before it demonstrates that easy capital flight will ensure that anything less will be ineffectual.
Conclusion
In this section, I’ve outlined the four most promising categories of non-violent economic levelers: land reform, debt relief, economic crises, and policy changes. There are a few non-violent levers that have managed to reduce income and wealth inequality: namely the reliance on another country’s military presence for land reform, large national declines in consumption, and the very specific example of the Great Depression. Government-enforced debt relief has inconclusive results, emancipating slaves has worked, but seems to always be accompanied by great violence. So we’re left with either being conquered in a war and relying on the victors to support economic redistribution, having our quality of life decline substantially through contractions in consumption, or living through an unprecedented international economic meltdown and the accompanying individual unemployment and social instability.
But all is not lost! In the final part of this series, Part 5, I’ll provide hope by distinguishing between causation and correlation. Just because things are unequal, doesn’t mean bad stuff happens, and that’s an important distinction. Plus, trying to defy history is not just the right to do, it’s also the cheapest thing to try.
How I Learned to Stop Worrying and Accept Income Inequality: Part 3
How I Learned to Stop Worrying and Accept Income Inequality Part 3: The Violent Forces that Change Income Inequality

This blog post is the 3rd in a 5-part series on income inequality. Click below to navigate between the parts of the series:
Part 3: The Violent Forces that Change Income Inequality
As I outlined in part 2, stable, low-growth societies tend to become increasingly unequal because the rate of return on capital exceeds the growth rate of the economy. Given a long enough period of time without any great shocks, these societies reach very high levels of income inequality at or near the economic subsistence level and stay there.
People Want Big Changes
In part 3, we will discuss how societies become more equal with regard to their income and wealth distribution. But first, I want to address a matter of measurement.
When people today talk about reversing income inequality, I believe they are referring to a specific historical moment in the recent past: the middle part of the 20th century when most western economies had Gini coefficients in the .3 to .35 range as compared to .45-.5 today. A change in the gini coefficient of even a few points (.30 to .33 for instance) would be a substantial change in the income distribution for a country, but isn’t likely to be noticed by individual people in their daily lives. The sorts of changes that are noticed by people at the population level are the big swings. The shift from a Gini coefficient of nearly .8 in Great Britain before WW1 to around .3 in the 1940s was obvious to most people living through the transition.
The distinction between big and small shifts is important to a discussion about the forces that change economic inequality because if people demand big changes, then the list of likely candidates to produce those changes is quite small. By contrast, if people demand only small changes, then the list of forces capable of delivering this are correspondingly large.
I do not think that most people today would be appeased by a 1-2 point change in their country’s Gini coefficient. People are seeking far greater redistribution. So, for the next two parts in this series, I will focus on forces capable of radically altering income inequality vs those that have the potential for small incremental gains. In this section, I will focus on the violent mechanisms of change and in the next part, I will discuss peaceful alternatives.
The 4 Horsemen
If we confine our discussion of forces that change income inequality to just those capable of producing large equalizing results, the historical record is very clear about the most probable and effective mechanism: human violence. But it’s not just human violence - the capacity for changing income and wealth inequality is directly linked to the intensity of the violence. Below a certain threshold of violence, and very little equalization occurs. But if human violence becomes extreme enough, it has a consistent track record of making societies more equal. The primary mechanism is by destroying the wealth of the elites, which doesn’t tend to help the poor so much as make them relatively less poor. There is some actual redistribution of income that occurs during plagues when real wages for the poor rise, but on the whole, violence levels societies by destroying elite wealth.
This is unlikely to be a surprise to most people who have thought about this problem. The richest people enjoy being rich. The poorest people do not enjoy being poor. Without a credible threat of violence, the rich have no reason to share their wealth and the poor have no way to force the issue.
In his book The Great Leveler, Walter Scheidel lumps violence into 4 categories that he calls the 4 horsemen: mass mobilization warfare, revolution, state collapse, and plague. Through exhaustive historical research, he reconstructs the income distribution of societies throughout history and finds consistent evidence that 1) violence is the primary mechanism of income equalization and 2) the intensity of the violence is strongly correlated to the effectiveness of that equalization.
Something that was uncovered in the course of his research that I found surprising is that while these forces are effective at equalizing income, they tend to leave behind societies of relative impoverishment. There are no known examples of mass income and wealth equalization that leave society as a whole in an equal or better material position than prior to the shock.
Mass Mobilization War
Humans have probably been killing one another since the beginning, but war as most people know it is a modern invention driven by agrarian societies with large populations. Conflicts like those described in The Bible and among other ancient empire states, however, tended to be quite constrained in their scope. This was due to population dynamics. Even enormous empires did not have societies efficient or fertile enough to keep more than 1-2% of their population deployed in an active war for any sizeable period of time. Records suggest that Rome, for instance, kept perhaps 400,000 men under arms out of a population of ~60M, representing .6% of the population. Likely the largest military force in antiquity, the Northern Song Dynasty, probably fielded as many as 1 million soldiers in the 11th century CE, but that was still only ~1% of the population. Ottoman mobilization levels were lower still. The reason for this historical constraint on mobilization was due to food surpluses, age distributions, and disease.
In most premodern societies, producing food was orders of magnitude less efficient than today. Even during periods of peace and health, populations frequently bumped up against their carrying capacity. Feeding large armies was a much greater challenge in 1000 CE than it is today. As a result, there was just less excess food that could be given to standing armies.
Then there was the matter of age and gender. Up until the very recent past, and with very few exceptions, militaries only drafted young men. Depending on the exact demographic shape of a society, a 2% overall conscription rate could mean as much as a 50% draft among young men fit for military service. That meant that an ill-fated war could dramatically stifle population growth in the next generation by killing off a sizable portion of future fathers.
Finally, there was disease. Historically, diseases killed more people in war than direct military violence. The longer that an army was deployed, the greater the attrition to maladies like yellow fever, malaria, cholera, and plain old fashioned dysentery. As a case in point, it was only during World War 1 that American medicine was able to curb war deaths due to disease equal to battlefield deaths.
For all of these reasons, historical warfare, for all its horror, was a relatively constrained experience. Most of society was unaffected by the king’s current military conquest because wars were shorter, cheaper, and less fatal.
From an economic perspective, historical warfare also tended to be less impactful because it was frequently zero-sum: the winner plundered the loser and that was that. Because the physical damage caused by war was relatively constrained, wealth was already so unequally distributed, and only the wealthy and professional soldiers participated, there was very little change in a nation’s income or wealth inequality as a result of winning or losing wars in antiquity.
All of this began to change during the industrial revolution. Better farming, medicine, and weapons made it possible to deploy far greater segments of the population in fighting conflicts. In the process, war went from being the pastime of kings and a redistributive game to an experience that completely transformed nations and their economies into war-fighting machines. The exemplars of this mass mobilization warfare were the two world wars at the beginning of the 20th century which witnessed entire nations change their way of life over night to fight and win the conflict.

This graph comes from Walter Scheidel’s The Great Leveler.
And this level of mass mobilization had a profound economic leveling effect:

This graph comes from Walter Scheidel’s The Great Leveler.
This precipitous economic leveling has been termed the Great Compression and is largely defined as the period of time from 1914 to 1945. To put this in perspective, we can expand the time window and add additional countries:

This graph comes from Walter Scheidel’s The Great Leveler.
What is so striking about this graph is how little most wars appear to have affected top 1% wealth shares. The American Revolutionary War, the War of 1812, the first Opium War, the Crimean War, The Franco-Prussian war, the Napoleonic Wars, the first Boer War, the Spanish-American War, and the Second Boer War (just to name a few) all occurred during this time interval and involved the countries listed above. These wars appear to have had little, if any, lasting effect on the share of wealth held by the top 1%, whereas World War I and II had an enormous effect.
The takeaway here is that mass mobilization warfare is tremendously effective at leveling wealth and incomes, but most warfare throughout human history has been far less effective because most wars did not require societies to reorder themselves as extensively to fund military efforts. These efforts led countries to curb non-military manufacturing, draft large segments of the population, cap profits in key industries, forbid certain resources from being consumed by civilians, and critically, raise taxes to cover war costs. In the following graph, you can clearly see the effect of the two world wars on top rates of income and inheritance taxes across 20 countries from 1800-2013:

This graph comes from Walter Scheidel’s The Great Leveler.
These tax rates were necessary for funding the world wars. They were rapidly introduced and then gradually repealed, with the greatest decline in taxation occuring in the 1980s.
Mass mobilization war is capable of the greatest income and wealth equalization that has been recorded in recent history. Minor wars, despite their horror, are unlikely to equalize income or wealth. It is the intensity of violence and its effect on society that has the capacity to bring about change.
Revolution
Continuing the theme of extreme violence creating extreme redistribution, we turn now to the topic of revolution. In the previous section, I focused on the world wars as levelers. In this section, I will dive into prominent revolutionary examples, starting with the Bolsheviks and Mao and wrapping up with some of the lesser-know examples from recent history.
Despite modern preconceptions, Czarist Russia was not particularly unequal. The best guesses for relevant market income Gini for the early part of the 20th century is around .36. Despite this, the Bolshevik revolution began in November 1917 and was successful in wresting power from the Czar. Stalin’s efforts throughout the 1930s to further rid the country of “kulaks” (Lenin’s term which literally means “fists” as in “tight-fisted”) resulted in the deaths of millions of people as those deemed slightly more affluent were jailed, sent to gulags, deported, or simply executed. All of this violence proved to be highly successful at leveling Soviet income and wealth inequality. By 1967, the Soviet Union’s Gini coefficient was at .27. To put this into perspective, the Gini coefficient in the US today is .41.
A similar story played out in Maoist China. Throughout the 1940s, similar processes to the Bolveshik revolution played out in China, resulting in the deaths of 1-2 million people by 1952. But the Maoist leveling of the 1930s and 1940s paled in comparison to the Great Leap Forward in the late 1950s wherein failed government agricultural policy lead to the deaths of millions more Chinese citizens. By the end of the Maoist period, 6-10 million Chinese had been killed or driven to suicide by the state, and another 20 million had died in a gulag-style forced labor system. This, too, culminated in tremendous leveling. The Gini in China in the 1930s, prior to the revolution, is thought to have been around .4. By 1984, it had dropped to .23. China’s Gini coefficient today is ~.61.
But if we turn our attention to other revolutions, it quickly becomes apparent that most revolutions fail to produce much leveling, and there is a strong correlation between levels of violence and leveling outcomes.
Probably the largest survey of revolts was compiled by Kent Gang Deng, who looked at 269 “major peasant rebellions” that occurred in China over 2,106 years. Equality of land ownership was frequently cited as a motivation for rebellion, but very few succeeded in overthrowing an existing government. Among conspicuous examples of those that did (Li Zicheng in the mid 17th century and the Taiping rebellion in the mid 19th) no equalizing effects can be observed.
The list goes on for centuries of uprisings. Even when intentional leveling is the goal of the revolting peasants (which it is often not), revolts are limited in nature, rarely successful at overthrowing even local governments, and rarely re-distributive. As Walter Scheidel puts it: “Deliberate systematic leveling through violent revolt was beyond preindustrial means. Only in the twentieth century do we encounter revolutionaries who wielded both machine guns and radical programs.”
State Failure and Systems Collapse
When governments collapse, societies experience a loss of social complexity, stratification, division of labor, transmission of information, and investment in cultural goods and services like monuments, art, literature, and literacy. State failure and systems collapse are highly effective at leveling inequality in societies by rapidly reducing a society’s affluence back to subsistence levels.
One of the most compelling and well-known historical examples of state collapse is the fall of the Western Roman empire. Prior to this collapse, the Roman state featured some of the most extreme income and wealth inequality in recorded history. During this time, the wealthiest Roman politicians held villas and property across the entire Mediterranean. Two landowners from Gaul are known to have owned estates in Italy and Spain, and in the southern Balkans respectively.
The empire began to disintegrate around 430 CE and eventually resulted in the loss of North Africa, Gaul, Spain, Sicily, and finally even Italy itself throughout the fifth and sixth centuries CE. The resulting collapse of Roman military protection hit hard in far-flung areas of the former empire and has afforded modern economists a unique opportunity to measure the impact of the process.
Using the size of roofed houses in square feet as a proxy for wealth, Robert Stephan studied the changes in house sizes before, during, and after the Roman collapse in Medieval Britain, which was hit particularly hard by the transition. The resulting analysis clearly shows a strong pattern of accumulation and leveling linked to the fate of the Roman empire:

This graph comes from Walter Scheidel’s The Great Leveler.

This graph comes from Walter Scheidel’s The Great Leveler.
Other empires have followed similar trajectories. The Mycenaean civilization’s collapse around 1200 CE, the polity of Tiwanaku in 1000 CE, and the Mayans in the 9th century CE were all marked by the same general arc. Archaeologists studying grave sites record a growing number of luxury items buried with the dead as these societies reached their zenith followed by a complete disappearance of the same archaeological markers of wealth. There is strong evidence that the fall of states redistribute income and wealth.
During this section, I’ve used the term “collapse,” but I want to reiterate that all of these examples involve invasions, the murder of entire classes of society, or the implied starvation and infighting of a society no longer capable of feeding itself. To call any of these transitions peaceful would be a tremendous misunderstanding. Here again, we find violence to be the key mechanism capable of taking resources from the wealthy and giving peasants the opportunity to economically advance in the rubble.
Plague
Epidemic disease has the potential to be a potent leveler in a way distinct from the forces discussed above. Unlike war, revolution, and state collapse, disease often leaves capital (goods, buildings, boats) behind and simply acts to remove humans from the equation. As labor becomes relatively more scarce compared to capital, labor becomes more valuable, wages increase, and the relative gap between the haves and have nots compresses.
The most famous epidemic in the western world is undisputedly the series of plagues that struck the world in waves starting in 1345. Modern estimates suggest that between 25 and 50% of the worldwide population was killed between 1300 and 1400. England and Wales in particular didn’t recover their populations until nearly 300 years later. The economic effect of this catastrophe was immediate. Jean de Venette, a Carmelite Friar, recorded this sometime around 1360:
“In spite of there being plenty of everything, it was all thrice as expensive: household equipment and foodstuffs, as well as merchandise, hired labour, farm workers, and servants. The only exception was property and houses, of which there is a glut to this day.”
Governments attempted to curb rapidly rising wage demands from laborers and were unevenly successful. In France, initial attempts to prevent wages from rising were initially attempted in 1349, but were abandoned a mere 2 years later at which point wages had risen by approximately 33%. In other parts of the Western world, wages rose by as much as 50-100% in the mid-14th century and remained historically elevated for 2-300 years, falling slowly back to pre-plague levels. This dramatic spike can be seen in the rural real wages measured in grain in England from 1200-1869:

This graph comes from Walter Scheidel’s The Great Leveler.
As wages for unskilled labor rose, the wealth of the elite fell precipitously. This was due to the large and sudden increase in labor costs to maintain private enterprise and estates, as well as losses caused by social turmoil. As with all other disruptions to the social order, the wealthiest members of society had the most to lose, and they lost a large portion of it. To illustrate this point, here are the wealth shares and Gini coefficients of wealth distribution in Piedmont between 1300-1800 (first graph) and Lucca 1331-1561 (second graph):


These graphs comes from Walter Scheidel’s The Great Leveler.
Lethal epidemics have the capacity to rapidly level income and wealth inequality by creating social unrest, spurring violence, and raising the comparative value of labor. These effects are both immediate and long-lasting, but not permanent. With every plague mentioned above, real wages and wealth inequality did return to pre-plague levels as societies stabilized, labor became more plentiful, and elites were able to exert greater control.
Conclusion
Okay, so you made it through the toughest part of the blog series. Now follow me to Part 4 where I cover the topic you’ve been waiting for: peaceful alternatives to all the blood, death, and gore. Only problem is, they don’t work that well, or really at all.

How I Learned to Stop Worrying and Accept Income Inequality: Part 2
How I Learned to Stop Worrying and Accept Income Inequality Part 2: A Brief Primer on the History of Income Inequality

This blog post is the 2nd in a 5 part series on income inequality. Click below to navigate between the parts of the series:
Part 2: A Brief Primer on the History of Income Inequality
Most people alive today grew up during a historically unprecedented period of global income equality that began around 1914 and persisted through the 1980s. Even after income inequality began to rise again during the early 1980s, cultural norms around inequality take time to adjust, and it has only been since the great recession of 2008 that the topic has become so high profile and politically polarizing.
At least for the past 500 years, income inequality has been persistently higher than during the mid-20th century. Measurement of income inequality is difficult and spotty the farther back in the past economists try to measure, but recent estimates derived from historical documents suggest that Gini coefficients in the .4-.6 range have been fairly common. The US today has a Gini of .41 and in the late 1940s, it was around .3.

This graph comes from Branco Milanovic’s Global Inequality PDF supplement.
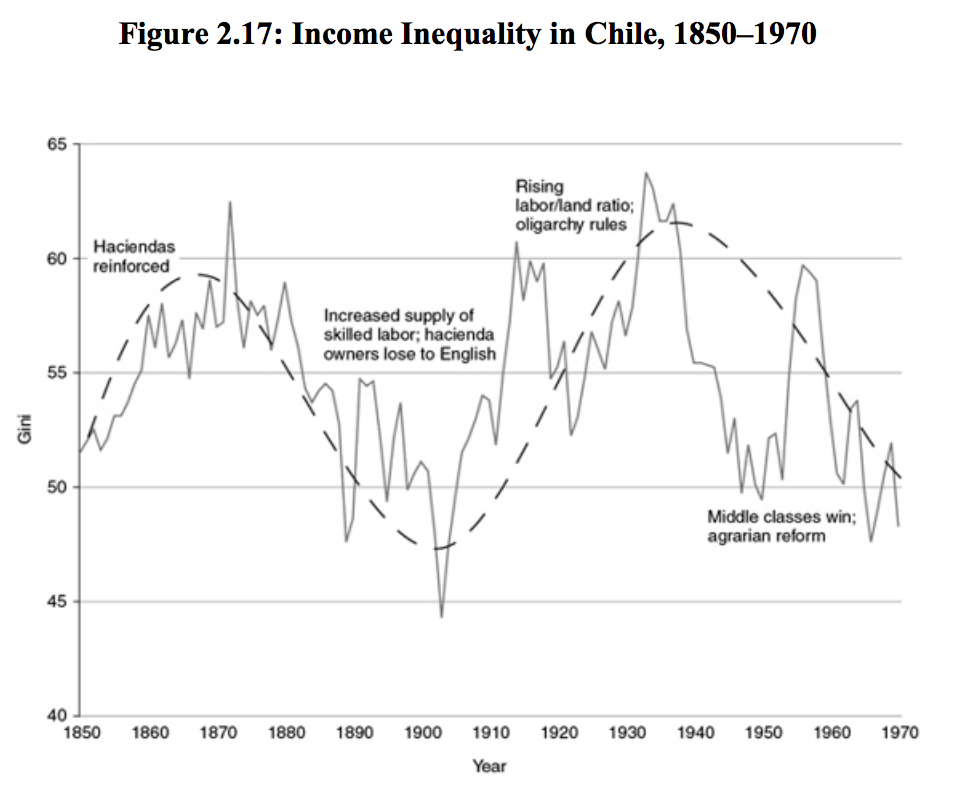
This graph comes from Branco Milanovic’s Global Inequality PDF supplement.
As Picketty and Scheidel discuss in their books, these graphs illustrate that in the absence of violent shocks to economic systems, income inequality tends to rise from low to high levels and then remain there. This is what the second graph above illustrates: between the reforms and revolts of various elements of Chilean society, income inequality rose substantially, briefly plateaued, was interrupted by violence, then repeated the cycle.
The reason for this upward trend in absence of violent shocks is the relationship between the return on capital and growth rate of an economy. When the rate of return to capital (denoted r) exceeds the growth rate of an economy (denoted g), then the ownership of capital (and by extension incomes) will tend to become increasingly unequal. Here’s why: in an economy in which growth is very high, wages will grow faster than, and be more lucrative than, owning capital. Since capital has always been concentrated in the hands of the few, rapidly growing returns to labor tend to reduce inequality by making the working class wealthier.
An Example of R > G
For the vast majority of recorded human history, the rate of return on capital r has been greater than the growth in economic output g. What isn’t immediately obvious is how r > g in these societies actually resulted in the growth of income inequality. So let’s work through a quick example.
Imagine a country in which output growth is 0% - every generation of people creates exactly as much economic output as every previous generation. To keep this simple (and historically accurate), imagine further that this society has only one kind of capital asset: land. Due to randomness, a small number of people start out with slightly more land than others and they are able to rent their surplus land to other people. Historically, rents on capital return 4-5% of their value per year on average.
Barring any external shocks, the first generation in this country would have a very low Gini coefficient because everyone has approximately the same amount of capital. But by the end of the first generation, the people who started out with slightly more land will have rented their spare land to those who are less fortunate and earned 4-5% higher yearly incomes. Because there isn’t any other capital asset to buy in this fictional realm, the wealthier landowners will spend their surplus income to increase their land holdings. This process continues, with added income from capital being reinvested and compounding until the society looks like western Europe in the 17th and 18th centuries. During this period of time, Gini coefficients ranged as high as .7-.8, implying that an extremely small portion of the population (.1% or even .01% of the population) owned as much as 60-90% of all wealth (see the chart at the end of part 1 for a centile breakdown of what wealth ownership in that society looks like).
An Example of R < G
Now let’s rewind the scenario and assume a different starting condition: the same country with the same slightly unequal distribution of land, but the economy’s output growth is quite high - say 6% a year. This is roughly equivalent to China’s growth rate for the past decade. Historically, despite the attempts of wealthy capital owners to take as much of an economy’s growth as possible, a substantial number of laborers benefit directly from the compounding growth in productivity and a large portion of the newly created wealth accrues to the previously disadvantaged. So in this country, a newly productive farmer could see their real purchasing power increase by 6% a year while the capital owner would still only be able to rent their land at the historical average of 4-5%. Assuming that capital owners and laborers save about the same amount of their incomes, laborers in this second country would become wealthier than capital owners. This effect will naturally keep the income and wealth distributions more equal.
We see this in the historical record: in the absence of violent shocks, high growth rates are capable of making large societies substantially more economically equal in a very short amount of time.
We don’t need to look farther than the last century to prove the case. Most nations that participated in WW2 (with the notable exception of Russia) experienced a rapid growth in economic output from 1945 through the mid 1970s. During this time, Gini coefficients in many nations hovered between .3-.4 and the middle class grew rapidly.
What Affects Output Growth?
So, exactly what causes economic growth to accelerate? To many people, it appears that the primary driver of output growth is a category of improvements that economists call productivity gains. These are new machines, technical capacities, processes, and ideas that permit a single person to produce more goods and services per unit time than was previously possible. The most often repeated examples of these improvements in the 20th century are inventions like the assembly line, the internal combustion engine, and nitrogen fertilizers.
While it’s true discoveries like these have been instrumental in boosting growth, the biggest single contributor to economic output growth throughout history — accounting for approximately 50% of growth by most measures — is simply population growth. History strongly suggests that the more humans there are, the more productive we have become at producing the things we want.
The next biggest contributors to output growth appear to be what most modern readers would consider to be mundane: the dramatic decline of infant mortality from interventions like better hygiene, clean water, antibacterial drugs, and more readily available medical care.
Technology has contributed substantially to output growth, but the impact has been falling since the early 2000s. Starting in the 1870s, technology had a sudden and profound impact on the growth rates of industrializing countries. Everything from railroads to airplanes, to canned goods and electricity rapidly made human life more productive. In Gordon’s book, he makes a very strong case that despite the changes invoked by information technology starting in the 1980s, for most people, life today is materially similar to life in the 1940s. Despite the internet, computers, and smart phones, output growth across most of the world is now much lower than it was during the period 1870-1940. In fact, since the early 2000s, the effect of technology-driven productivity gains have vanished from most economist’s calculations, suggesting that new digital inventions have failed to boost growth in any meaningful way at a macroeconomic level.
Again, If you’re interested in a deep dive on any of the topics in this subsection, pick up Gordon’s The Rise and Fall of American Growth, which expands this summary into 784 pages.
Peaceful, Low-Growth Societies Are More Unequal
The examples above illustrate a crucial point: societies where output growth is low trend toward highly unequal distributions of income and capital ownership. This is interesting because it clarifies something that most people sort of pick up from life experience without any study: when growth is low, the past eats the present. For most traditional societies, there was no way to earn enough from labor to amass anything close to the level of wealth provided by inheriting an old fortune. A random event 200 years ago (your great-grandfather found gold in the mountains, for instance) compounds into staggering inequality that becomes self-perpetuating.
The world in the 21st century appears to be trending towards lower growth rates due in large part to falling fertility, aging populations, declining productivity growth in technology, rising public debt, and increasingly expensive education and healthcare. This suggests that paradoxically, the future will look a lot more like the distant past than did the 20th century’s anomalous equality. And at least in terms of income inequality, we’re already there. As shown in the chart at the beginning of this section, American wealth and income distributions today more closely resemble the end of the gilded age than the 1950s, and current political and economic forces appear poised to reinforce rather than disrupt that trend.
A Note on International vs Domestic Inequality
Throughout the last several hundred years, wealth and income inequality has been defined at the national level: there were poor countries and wealthy countries. Poor countries had low Gini coefficients, but similarly low rates of consumption and per capita income. Rich countries had high Gini coefficients with extraordinarily wealthy people controlling large amounts of national wealth. Importantly, however, poor people in rich nations tended to be far more wealthy than average people in poor nations. Citizenship was an enormously powerful predictor of economic outcomes at the individual level. Those born in rich nations had a high probability of living lives of relative ease, while those born in poor nations had the opposite luck. An easy example of a poor and rich country in the 18th century would be China and Britain respectively.
This divide held true until the middle of the 20th century when most of the previously poor nations began emulating rich western nations. This led to unprecedented yearly growth in countries like China and India as their economies started to catch up to the wealthiest western nations (note this chart is in log scale):

Chart comes from Branco Milanvoic’s Global Inequality pdf supplement. Note the log scale of the Y-axis.
At the beginning of the 20th century, it was factually correct to think of people as rich or poor based upon their nationality. British citizens enjoyed higher standards of living and were substantially wealthier than people living in Zaire, Columbia, or Thailand. Starting in the 1950s, the world became more complicated. Wealthy nations saw their relative economic supremacy rapidly erode as nations like China emulated western innovations and billions of impoverished people climbed their way into the middle class as a result of rapid economic growth (r < g).
This led to a sustained period of fear in the US, Britain, and other wealthy western nations about being overtaken by prosperous nations like Japan (1980s) and China (2000s) whose economies were growing quickly. It’s never possible to know with certainty why nations change political direction, but one interesting argument for the rise of the neoconservative movement in the US was that it was a reaction to an increasing sense that the US had lost its edge relative to other nations. In this light, liberal politicians had been given adequate opportunity to try their hand at keeping American economic exceptionalism alive and well, but they failed. As a result, a slew of pro-business legislation was tried instead. Most of that legislation had the effect of enabling the wealthiest to become wealthier faster. Trickle down economics, tax cuts for the wealthy, intentional and unintentional holes in the tax code for inheritances, capital income, and inter-generational gifts have all figured prominently since the 1980s in the US. And it wasn’t just an American phenomenon: across the Atlantic, Thatcher enacted similar policies. Both nations have shown a pronounced acceleration in income and wealth inequality since that time.
By the early 2000s, the world had changed from one in which standards of living were defined by national origin (Americans were rich, Chinese were poor) to one in which a person’s standard of living was defined by their place on the income distribution within their own country. Today, wealthy Chinese citizens enjoy a much higher standard of living than most middle class Americans and many poor Americans have a standard of living worse than even a middle class citizen in India.
I believe there is a strong argument to be made that this trend is the driving force behind growing political populism, anti-globalism, and anti-capitalism.
Conclusion
Make the jump to Part 3 in which we get into the exciting world of violent leveling with Scheidel’s 4 horsemen: mass mobilization warfare, revolution, state collapse and plague. Although they represent a grim way to alleviate income and wealth inequality, I’ll provide an argument that they are also the most effective.

How I Learned to Stop Worrying and Accept Income Inequality
How I Learned to Stop Worrying and Accept Income Inequality Part 1: Backstory and the Distinction Between Income and Wealth

Part 1: In Which I Read Books and Provide Backstory
This is a long 5 part blog series in which I will attempt to convince you that global income inequality is a malady whose most likely cure is worse than the disease. I formed this belief after reading several recent economics books on the topic: The Great Leveler by Walter Scheidel, Capital in the 21st Century by Thomas Picketty, Global Inequality by Branco Milanovic, and The Rise and Fall of American Growth by Robert J. Gordon. Where it is worthwhile, I’ve referenced these authors and used their graphs and charts, but for anyone interested in the topic, I would recommend reading the books in full as they provide a fascinating deep dive into the topic.
I’ve structured this series as follows:
My thesis and the supporting evidence is pretty depressing, but I want to get started on a positive note. Even though I am going to strenuously argue that there is no historical evidence that peaceful mechanisms can reverse the current trends in income and wealth inequality, I still believe they are worth trying because they have such tremendous upside. If current voters and policymakers pull off a large and persistent reduction in income and wealth inequality, I believe it will lead to incredible improvements in human life. It would also break a trend of violence and suffering going back as far as recorded history. It would, in short, be a momentous event in which I want to participate.
Backstory
I grew up in rural Ohio in a town of 7,100 people. Back in the 1940s and 1950s, the town had several major industrial manufacturers. GE was making light bulbs, a GM contractor was making car parts, there was a metal grinding factory, and a brick factory. As with most of the rust belt, by the time I moved there in 1998, all of these industries were either dying or dead and many people in the town commuted the 70+ miles up the interstate to work in Columbus. My Dad worked at the incongruously located Ohio EPA office in town and my mother made the 30 mile commute to Ohio University where she was a subject librarian. And so despite the economic decay, I had a stable upbringing.

A representative photo of downtown Logan, Ohio.
By the time I became aware of national politics, I had spent all of my formative years in the rural midwest and had come to understand the emotionally raw sense of injustice about the national economy shared by many of my classmates’ families.
I left for college and studied economics. Eventually I made my way out to Silicon Valley, where I became a product manager at a big tech company, creating products that increase inequality by making capital ever more efficient. A full 10 years after leaving the midwest, I still frequently ponder the disconnect between the liberal macroeconomic worldview that pervades California and the reality of forgotten places like my hometown. During Obama’s administration and into Trump’s, I was equally baffled and dismayed at the rhetoric concerning income inequality. Washington technocrats condescend to “help” the common man without an understanding of life on the ground. At the same time, Republican policies work against the economic interests of those who are most in need.
So I set out to learn whether history could teach us anything about how societies become so unequal. I discuss this in greater detail in part 2, but it seems clear that we arrived here because the rate of return on capital has been greater than the economy’s growth rate since the mid-1970s. That led me to wonder whether it was possible to unwind that dynamic to get to a place that’s better for almost everyone except a tiny minority of wealthy people.
What I learned in the course of that research convinced me that although I think it is our moral duty to pursue peaceful ways to reallocate wealth, history suggests the odds of that working are very slim indeed. The most likely paths to meaningful income and wealth redistribution are too horrible to wish on our enemies.
Income vs Wealth
Let’s contrast “income” (how much money you make) with “wealth” (how much money you have). When discussing economic inequality, many headlines play fast and loose with the distinction between income and wealth. There is a huge difference between the two, but we mostly talk about income. Why? It’s simpler.
Most adults have been an employee and understand the experience of being paid for their labor. This familiarity makes it easy to draw emotional reactions from readers. If I told you I was paid $1 million this year, it would be easy to understand the human experience that lead to that paycheck: I probably went to an office somewhere, did something nondescript, and I got a check with lots of zeros on it handed to me by a guy in a suit. It’s concrete and it’s easy to feel cheated because yearly pay of $1M would be 33x the per capita income in the US. Without a time machine, it’s not physically possible to work 33x more hours, so there must be something grossly unfair about that setup.
Income is also just less complex. The average net worth of a household in the US in June of 2019 is just shy of $100,000. Most of that wealth is home equity. That’s pretty easy to explain: I saved a bit of cash, I bought a house and that’s my wealth. But for rich folks, wealth is a lot harder to explain. To make it into the top 1% of household wealth in the US, you’d need ~$10M. For those households, it’s unlikely that more than 10-20% is home equity and the remainder is not in a checking account. Even a very conservative household in this wealth bracket owns a broad mix of financial instruments: things like ISOs, RSUs, common stock, index funds, mutual funds, bonds, treasuries, and CDs to name just a few. As you move from top 1% to top .1% wealth, things get even more exotic with complex financial instruments, ownership stakes in hedge funds, stock puts, shorts, and a grab bag of stuff that I’m not wealthy enough to explain.
In short, wealth looks very different between the middle class and the rich, and even more different between the rich and the hyper rich. As an example, imagine trying to explain what a REIT is to someone that lives below the poverty line and rents a hotel room week to week. The distance in comprehensibility is even greater between the middle class and top .1% of wealthy households. While it’s possible to do what I just did and emotionally explain the difference, it’s much easier to just talk about income. And so that’s what most people talk about.
And that might be for the better, because wealth inequality is far more stark than income inequality. Right now in the US, top 1% household incomes are defined as those above ~$420,000, which is “only” about 7x the real median household income of ~$60,000. Top 1% wealth, however, starts at around ~$10M for households, which is ~100x the real median average household wealth of $100,000. In other words, wealth is about 14x as concentrated as incomes.
Since wealth is so much more concentrated than incomes, I think it makes sense to look at it visually. The chart below from Picketty’s Capital in the 21st Century provides a good overview of just how much wealthy people own in a society. The US is currently in the second-to left column “High Inequality.”

This graph is taken from Picketty’s Capital in the 21st Century.
To slice this data differently (and provide a more up to date estimate of wealth inequality), I would recommend checking out this infographic from the Independent and Credit Suisse’s global wealth report.
Conclusion
In Part 2 of this series, I establish that the world today isn’t all that unequal by historical standards, explain why the rich get richer and the poor get poorer, and provide a brief explanation for why our standard of living is approximately equal to the standard of living in 1940.
Optional Glossary of Terms
I have tried to write this series without the use of unnecessary economics jargon, but some jargon is unavoidable, so I’ve put together a quick summary of terms that will help explain what I’m talking about.
The Gini Coefficient is the most common way to measure income inequality. It measures the inequality among values of a frequency distribution. A Gini coefficient of zero expresses perfect equality, where all values are the same. A Gini coefficient of 1 expresses maximal inequality among values. To illustrate this with an example, if you had $100 and 100 people, a Gini coefficient of 1 describes the circumstance where 1 person has $100 and the remaining 99 have $0. A Gini coefficient of 0 describes the circumstance where every person has $1. Although the Gini Coefficient is imprecise and fails to clarify the exact nature of the inequality (by overlooking income or wealth inequality patterns among specific centiles, for instance between the top 10%, 1%, and .1%), it is how journalists talk about this subject. As a result, I’ve chosen to use it for this series even though Picketty’s capital/income ratio is a more precise tool. For reference, in the US today, the Gini Coefficient is .41.
Capital is any possession that generates income for its owner. Historically, most capital has been farm land, but today, the majority is either homes or financial assets (stocks, bonds, etc).
The rate of return to capital (denoted “r” in this series) is the amount of money, expressed as a percent, that a capital asset generates for its owner on a yearly basis. For instance, if you had $100 invested in a stock and you received a $5 dividend after one year, the rate of return on capital would be 5/100 or 5%. Historically, the rate of return for most capital assets has been surprisingly constant -- 4-5%.
GDP. Gross domestic product is a measurement of how much value a national economy produces. There are a lot of different ways to get at this measurement, all of them complex. For the purposes of this blog series, you can think of it just as “the value of all the stuff that a country creates.”
Productivity growth. Although this one seems simple on the surface, it’s actually quite complex. Productivity growth is a concept that economists made up to explain how a person today can create far more widgets per unit time than a person in 1700. Many people think of productivity growth as another word for machines, but it’s more than that: it incorporates everything from knowledge, to processes, to abstract social agreements like property rights.